


Financial dashboards aren’t just pretty, colorful charts and graphs. They’re far more substantive than visual appeal and high-level insights – by light years. That is, assuming you’re leveraging the right data and tools to build them out.
To ensure your experience in both building and using dashboards is as beneficial, relevant, and insightful as possible, we’re going to take a closer look at what they’re all about. As you’ll see, it’s a big, bold, data-driven world out there for finance and accounting teams, and those that use the right tools in the right way for the right tasks are inevitably going to have an advantage. And we want you to fall into that category, so let’s dig in.
What Is a Financial Dashboard?
What comes to mind when you hear the word dashboard? Probably your car, right? Your gas gauge, engine temperature, oil pressure, maybe RPM – they’re in your car’s dashboard to give you a general idea of how everything is going under the hood. And they’re indispensable for anyone that relies on a car to get anywhere.

Financial dashboards work in a similar way, just able to dig far deeper into your business information than mere high-level glances. And that’s really why they’re so beneficial to CFOs and their teams, providing visualized data points on nuanced aspects of operations that would otherwise be buried within a spreadsheet somewhere.
By using dashboards, you’re able to combine data from multiple sources into one. Even better, you can interact with the data to change views and data sets, time ranges, and virtually any other variable you can throw at them.
As a result, you have sweeping self-service analytics that let your people dive into everything from executive level detail down to the lowest, most granular of insights. And these aren’t just any run-of-the-mill insights. Instead, they’re the basis for truly actionable business intelligence that can propel an enterprise to the top of its industry’s food chain.
Key Capabilities From Using Financial Dashboards
In short, financial dashboards let you transform information into actionable insights – genuine business intelligence (BI) – that are virtually impossible to generate in any other way. Of course, that depends on your willingness to invest immense amounts of time, effort, and resources taking a deep dive into countless Excel workbooks.
The Excel Issue
Speaking of Excel, reporting out of dashboards is so wildly different from what you’re probably accustomed to at this point, it’s going to take a while to acclimate yourself. And we mean that in the best of ways.
Think about the way you report right now – CSV files, your ERP, maybe some financial metrics, all cobbled together in Excel using VLOOKUPs. From there, you manually piece everything together into PowerPoints or PDFs for consumption. Sounds a bit antiquated, right? Maybe cutting edge, circa 2005?
Now we’re not trying to say Excel has no place in your daily functions. In fact, we fully understand it will always play some sort of essential role across your accounting and finance teams. However, that role shouldn’t be financial reporting – it’s just not what the fine folks at Microsoft designed Excel to accomplish.
In fact, Microsoft launched their very successful Power BI tool to give organizations better solutions than the analytics square-peg, round-hole scenario that Excel often leaves them with. So to be blunt, if Microsoft understands Excel’s limitations and the pressing need for more robust solutions, isn’t it about time companies stuck in 2005 technology do the same?
The Dashboard-Driven Alternative
Rather than keeping Excel the center of your reporting universe, financial dashboards eliminate those hyper manual processes you’ve likely been using for years, the ones with very limited automation – if any – and wrought with human error.
Dashboard reporting stems directly from your data sources, a fast and automated process that builds trust with the end-user since the data is always timely, reliable, and relevant. And since your leadership can access dashboard reports from a smartphone, tablet, or a simple URL, decision-making suddenly becomes incredibly fluid and agile.
Further, you can customize your dashboards to the specific needs of the end-user. Therefore, your CFO and staff accountants don’t have to use the same dashboards since they have different needs, all while still tying back to a single source of truth for consistency.
Perhaps most importantly, as new information becomes available, your systems automatically push it into your dashboard reporting environment. No more manual updates, top-side journal entries, or digging through mountains of CSV files, or patching data together from disparate sources so leadership can make informed decisions.
What, exactly, are the types of CFO dashboards can you use to inform your decision-making, you ask? Well, off the top of our head:
- Cash management
- Profit and loss
- Financial performance metrics
- Cash flow valuation
- CAGR (compound annual growth rate)
- Actual vs. forecasted expense
- Option valuation
- Margin analysis
- Risk-adjusted performance
- FX sales analytics
- Profit simulations
- Break-even analysis
- Other financial KPIs (key performance indicators)
Honestly, that lengthy list is only the tip of the BI iceberg. If the data exists somewhere in your systems, data repositories, or anywhere else other than someone’s gray matter, you can view, manipulate, analyze, and report on it. In real-time. And pretty much on any device with an internet connection.
In other words, from liquidity and profitability to operating expenses and budgeting, these business dashboards help you keep an ever-vigilant eye on the financial health of your enterprise. And that's an astounding competitive edge if we've ever seen one.
Metrics, Relevant KPIs, and Business Intelligence for the C-Suite
Of course, dashboards aren’t just handy for quickly building and delivering those specific financial reports we just mentioned. Thanks to the wondrous powers of data analytics, you can also build executive dashboards that are more broad-based and diagnostic in nature, filled with general metrics and KPIs that C-suite members can use to read the operational tea leaves, including:
- Net and gross profit
- Current ratio
- Quick ratio/acid test
- Working capital
- Debt-to-equity ratio
- Accounts receivable (AR) and accounts payable (AP) numbers
- Sales revenue growth
Put another way, well-constructed data dashboards can provide ‘everything from high-level, at-a-glance insights leaders need to quickly check the pulse of an organization, to a deep dive into very specific data pools.
Dashboards and Your People
From a practical, real-world perspective, data dashboards are certainly a new and better way to analyze your business information. And on paper, that’s a very good thing. However, if you’re to put your change management hat on for a moment, you know that people don’t always take kindly to something new, no matter how much better it might be.
Therefore, the benefits you realize from dashboards largely depend on your people actually embracing and using them. Yes, that sounds like an obvious notion but, as anyone who’s undertaken any semblance of a finance transformation initiative will attest, the simplest notions are often the biggest hurdles to clear.
So before you start building out those financial dashboards and living your data-driven dreams, we suggest hitting pause for a moment and looking through our insights on building a data culture across your organization. We promise it’s time well spent.
Telling a Data-Driven Story
Up to this point, we’ve been pretty direct with the role data dashboards could – likely should – play in your financial reporting. However, it's not just the wide range of information they deliver that makes dashboards so valuable. The way they deliver it is just as critical, with data visualization lending a convenience and immediacy you can’t replicate by other means.
Because of those aforementioned pretty and colorful graphs and charts, your data spells out a narrative for leadership, telling a data-driven story that makes everything more understandable and relatable in a very short amount of time.
Airline Use Case
For example, let’s say you’re the CFO of a small, up-and-coming regional airline. Your accounting and finance departments are prototypical lean and mean teams, usually stretched beyond capacity with frayed nerves and stacks upon stacks of responsibilities.
In short, efficiency is a top priority. Unfortunately, operating with such a small team means important metrics can easily slip through the cracks if you put all of your financial eggs in the Excel basket. And given how competitive and challenging the airline industry can be, your reliance on manual processes puts you at a distinct disadvantage relative to the competition.
Instead of those incredibly manual processes, though, let’s assume you’ve implemented dashboard reporting to streamline everything. And to take advantage of your newfound agility and insights, you’re looking over an Actual vs. Forecasted Expense Report on your iPad one day during lunch when something catches your eye.
According to the dashboard report, you’ve missed your quarterly projections, with expenses coming in well-above your forecasts. You decide to drill down further into the data through your different dashboards, noting a sudden and significant uptick in fuel costs that don’t stem from a rise in oil prices. So what gives?
Well, after an even deeper dive into your data dashboards, you ultimately discover that a recent and prolonged heatwave had negatively impacted fuel efficiency for your aircraft, driving your fuel costs upward. Mind you, all of this takes place in a matter of minutes, not weeks, days, or even hours. In the time it took you to eat a sandwich and salad, you were able to identify and diagnose a significant issue that you weren’t expecting.
Action Planning for the Road Ahead
From a macro perspective, your discovery prompts a renewed look at a robust ERM program for your organization, one that will help mitigate risks from climate change or escalating commodity prices in the future. And it all occurred over a single sandwich in your office.
In this example, your data quickly conveyed a powerful story, featuring operational protagonists, antagonists, and unexpected plot twists. And most importantly, that story led to a third-act resolution that would’ve taken far longer to see the light of day if you were depending on spreadsheets to deliver such critical data.
Financial Dashboards in the Wild: Examples and Insights
Finally, we want to leave you with some real-world financial dashboards examples for a closer look at how they give more meaningful insights into your business.
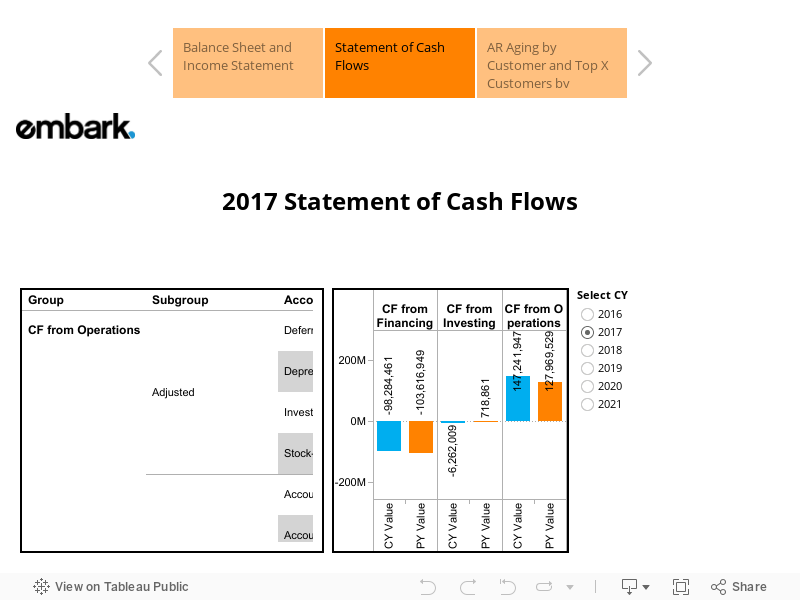
As you can see from the interactive financial dashboard example above, a smart, well-constructed dashboard is far more than graphs and tables. It’s closer to an insightful rabbit hole into your business information than anything else, a window into your operations that lets you compare and contrast data and continually peel the informational onion.
Want to see how your current liabilities stack up with previous year values? Or maybe from three years prior? Not a problem. That’s what the Balance Sheet and Income Statement report is for.
Same goes for your net profit margin, AR balances, cash flow from operations, or virtually any metric or report you can imagine. And since all of the data comes directly from your repositories, it will automatically update with the latest information. Can you even imagine trying to accomplish the same with Excel? Revisiting our car dashboard analogy, that would be akin to driving without a fuel gauge, speedometer, or temperature gauge. And that’s downright dangerous.
Thankfully, you don’t have to continue using Excel for tasks outside its worksheet sweet spot, assuming you're willing to take the transformation bull by the horns and start preparing your enterprise for the inevitable – a data-driven future. It’s sink or swim time for CFOs and their organizations, and Embark is just the team you need to ensure you rise to the surface.